Trading Part 1: Modelling
I’ve been investing for close to two decades and actively trading since about 2019, a few years before the Gamestop shenanigans caused retail trading to explode in popularity. Two summers ago I decided to get serious about trading, and to that end I have been developing an algorithmic trading application. This series of articles details some of my learning’s. I find that writing them out long-form helps cement the concepts in my mind, so this might be considered “study notes”, but I’ve decided to publish them here in case they’re of benefit to anyone else.
The Gambler’s Approach
I play poker (not professionally) and one of the best pieces of wisdom I picked up over the years is to only play statistically-advantageous positions. For example in poker we have the concept of the “pot odds”. Suppose you are playing Texas Hold’em and on the table there are 3 cards (the Flop) consisting of the 3 of diamonds, the 3 of clubs, and the 7 of clubs. Suppose in your hand you have the 4 and 5 of clubs. If a 6 of clubs come up on either the Turn or River cards then you have a straight-flush, and probably the best hand possible. There are four 6s somewhere in the deck and possibly in your opponent’s hands, but only one will give you the straight-flush. Any other 6 would give you a straight, and any other club would give you a flush. Both are powerful hands.
We can calculate the pot odds by first looking at the number of opportunities to get the card we need:
2 cards to come * 1 six of clubs = 2 opportunities
Similarly, given there are 5 cards known (our hole cards plus the 3 community cards of the Flop), there are 52 - 5 = 47 cards unknown, so:
2 opportunities / 47 cards = 4.3% (approx)
So we have about a 4% chance of making a straight flush. If we compare that to the size of the bet we have to call to see more cards (i.e. how much action we’re getting on our money) then we can decide whether it’s financially a good idea to call a bet or not.
Expected Return and the Volatility Risk Premium
This concept should not be foreign to Blackjack players either, and in my experience it translates very well to writing options or trading spreads. Nobody can predict the future but what we all really want is the best possible estimate of whether or not a trading strategy will be profitable in the long run. What this means is that we seek a strategy where any individual trade might be a loser but in aggregate our winners will outweigh our losers. One way we can see this manifest is through the Volatility Risk Premium, hereafter the VRP.
The term VRP refers to the phenomenon that Implied Volatility (IV), which is the volatility that the options market has “priced into” its premiums, tends to overstate the actual volatility of the same underlying instrument, known as Realized Volatility (RV) or Historical Volatility (HV). Thus, VRP represents a potential profit source for traders willing to accept the associated risk(s) by writing (selling) options. For those of you following along at home, we might write a call contract and sell it to the market. The holder of the call we sold has the option but not the obligation to buy shares from us at a specified strike price. In the event the strike price falls “in the money” the contract is certain to be exercised and thus we will be obliged to sell shares to the holder of the call at below market price, and therein lies the risk. In exchange for taking this risk on we are paid a small fee, called the premium.
To be profitable writing options we seek a strategy where we can sell contracts on a regular basis and get paid small premiums, and where the aggregate value of those premiums is greater than the cost to us if our options expire in the money. That is, we want a positive Expected Value, or Expected Return.
Expected Value = [ P(loss) * magnitude of loss ] + [ P(win) * magnitude of win ]
The magnitudes of losses and wins are easy enough to calculate but in order to arrive at a reliable estimate of our expected return we need to first have a reliable estimate of the probabilities of the outcomes.
The Normal Distribution
The naive approach might be to simply take the last N number of trading periods and compute their mean and standard deviation. Volatility is simply the standard deviation of returns, so that ought to work, right? Actually, it turns out that market returns are not well-described by the Normal Distribution. Whole PhD’s have been and will be written on market returns and their distributions, so I won’t do a deep dive here. Instead let’s just agree on the following, for the purposes of this article:
- Market returns have an approximately bell-curved shape but exhibit skew (they aren’t centered perfectly about the mean) and kurtosis (they have fatter tails than a Normal distribution does). Regarding the kurtosis in particular this means if we used a Normal distribution as a model we’d be understating tail risk.
- Market returns are generally unpredictable and follow a random walk (they don’t in real life but just for the sake of this post play along), sometimes subject to a trend.
- Market returns over a sufficiently short time frame have a mean of approximately zero, or close enough that we’ll just assume it’s zero. I’ll explore this further in a later post but for now just bear with me.
- Market returns over a sufficiently long time frame have a mean strictly greater than zero (this one should be obvious. Just look at the all-time graph of the S&P 500!)
Given all that, it’s hopefully clear why I don’t have confidence in the Normal Distribution’s descriptive power when it comes to modelling market returns. Additionally, in order to properly characterize the market we need to estimate realized volatility, since we know any value we get for IV from Black-Scholes or similar will overstate RV. Fortunately, vol can trend just like the market. There’s a saying I’m fond of that I’ve seen quoted in a lot of places that goes something like “the best predictor of tomorrow’s vol is yesterday’s vol”.
So with that in mind we’ll use historical returns to construct a model-agnostic distribution that will have recent realized volatility already baked in.
Constructing an Empirical Distribution
I have on my bookshelf an old copy of Anthony J. Hayter’s “Probability and Statistics for Engineers and Scientists, 2nd Edition”. On page 780 there’s a handy little box that gives the definition of an empirical cumulative distribution function. Here’s a scan:
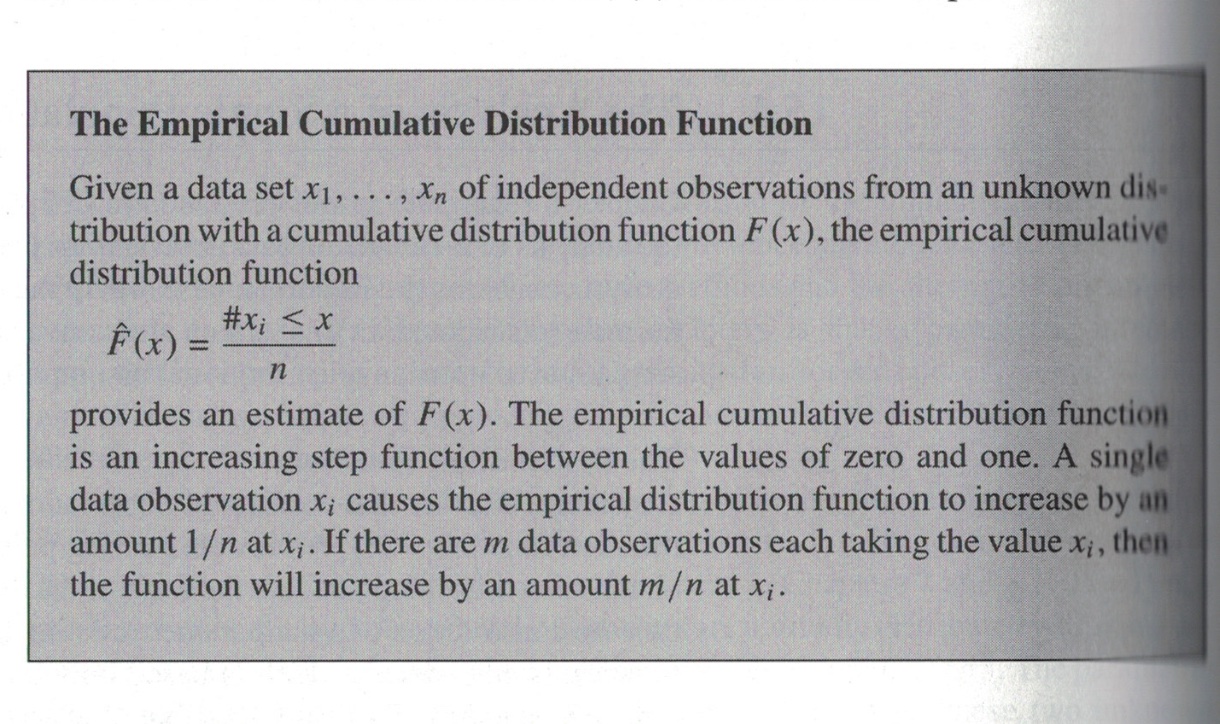
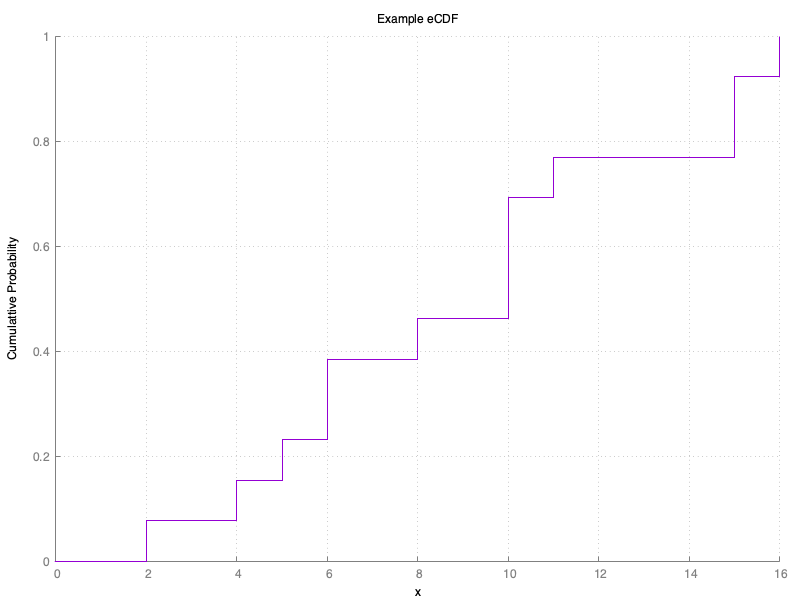
What this allows us to do is create a distribution from samples that approximates the distribution of the population (i.e. the “true” dynamics at play) without knowing anything about the shape of the population data, and without relying upon curve-fitting heuristics. What this looks like is a step function that, given N samples, jumps up by 1/N at each point along the x-axis where a sample data point occurs.
An eCDF, or an EDF, is a cumulative distribution function which means if we query it with some value a, the function returns the probability that x is /less than or equal to/ a.
Armed with our empirical probability distribution and a few other tools we’ll cover in a future post, we’re well on our way to finding trading strategies that are statistically most likely to be profitable.